

“We already have a drive-thru timer. What’s Vision AI going to tell us that we don’t know?”
It’s a reasonable question. Restaurants have enough technology to manage, and another dashboard needs to earn its place.
So let’s look at what happened at one QSR brand using Vision AI. We reviewed five quarters of drive-thru data, from Q3 2025 through Q3 2026, as the number of locations being measured grew from about 700 to 949.
The customer’s name will stay anonymous, but there’s plenty to discuss in the numbers alone.
First, what we care about most: did the drive-thru actually get faster?
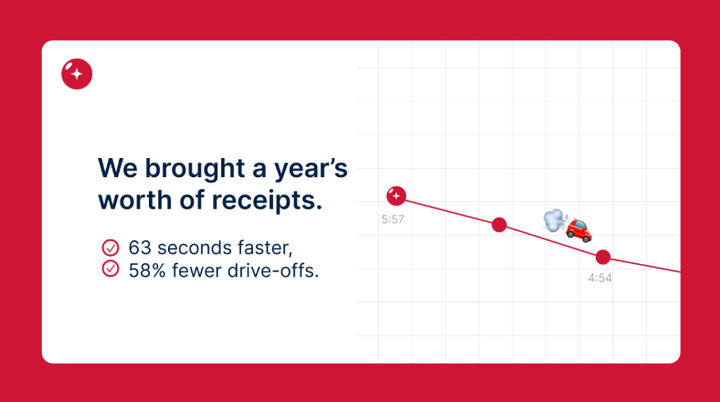
Average total drive-thru time fell from 5 minutes, 57 seconds to 4 minutes, 54 seconds. That’s a reduction of 63 seconds, or about 17%.
So, yeah, we can say it did.
That measurement covers the visit from entering the lane to leaving with food, including time spent pulled forward.
What stands out is how steadily that line comes down. There’s no big drop followed by a bounce back: average time fell every quarter, from 5:57 to 5:40, then 5:20, 5:08 and finally 4:54.
That improvement continued as the number of restaurants being measured grew from about 700 to 949. More locations, with all their operational differences, and the average kept moving in the right direction.
There’s some context to keep in mind: the group grew over the period, so these averages don’t represent an identical set of stores throughout. Even so, the expanding group finished with a substantially faster average than it started with.
Okay, it got faster. What about drive-offs?
Getting customers through faster is one thing. Getting them to stay long enough to order is another.
Over the same period, the drive-off rate fell from 1.06% to 0.44%, a reduction of about 58%.
Those percentages might not look particularly dramatic. But these are people who before would have made it to the restaurant and left without buying anything. You got them into the lane and still lost the sale. Major bummer.
Using a $15 average check, estimated lost sales fell from $47 to $18 per restaurant per day. That’s a $29 daily difference, which sounds fairly modest until you multiply it by 949 restaurants and 365 days. Then you’re looking at roughly $10 million a year.
That’s an annualized estimate based on drive-off counts and an assumed check size, rather than verified additional revenue. But it puts some perspective on the handful of cars leaving each day. It’s safe to say, a few cars here and there deserve some attention.
Okay, this paints a pretty good picture for Vision AI.
Now, what were teams seeing that a traditional timer wasn’t telling them previously?
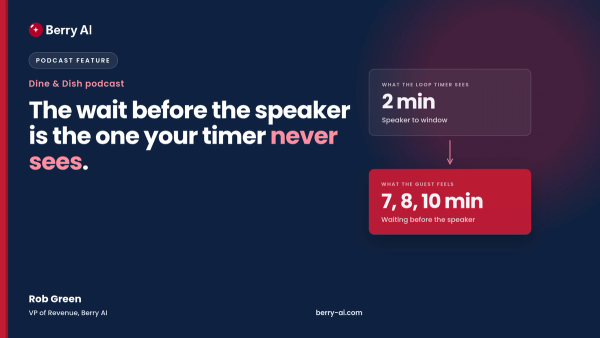
A timer can tell you how long a car spends at the speaker or window. But there’s a whole visit happening around those checkpoints.
How long was the customer waiting before reaching the menu?
Did they leave before ordering?
Did a quick window handoff turn into another few minutes parked outside?
For this brand, Vision AI followed cars through the full lane. Customers who drove off were counted, and pulled-forward cars stayed on the clock. Despite many operators’ claims, moving the wait somewhere else didn’t make it disappear. (Handy for the metrics, sure, but much less exciting for whoever’s still waiting on their fries.)
With stores measured consistently, teams could see where time was going and which locations needed attention. Crews had a live view, managers had daily reports, and leadership could look across the brand.
That gave people something specific to act on. “We need to get faster” is a pretty familiar instruction, but it’s dangerously vague. Knowing where the delay is happening gives you somewhere to start.
The timer question was fair. So here’s the answer.
Over five quarters, this brand took 63 seconds off the average drive-thru visit. That’s more than a minute per car, while the drive-off rate fell by 58%.
What would 60 seconds back look like across your restaurants? We’d want to know where that minute was hiding, too.
You can dig into the original report and calculations, or plug your own numbers into our revenue calculator to estimate what the improvement could mean for your restaurants.