

There’s a unique kind of lost sale that happens in drive-thrus all day long.
Someone is hungry. They’ve already decided where they want to eat. They’ve driven to the restaurant, turned into the parking lot, and are basically as close to becoming a customer as you can get without actually handing over a credit card.
Then they see the line. Maybe it’s wrapped around the building. Maybe it’s not even that bad, but they’re late getting back to work. Maybe they’ve been burned by this location before and know that six cars can mean 20 minutes.
So they leave. Perhaps they go across the street to your competitor (ouch). Perhaps they decide they weren’t that hungry after all. The restaurant will never know.
That last bit is unique to QSR. If someone abandons an online cart, we can track it. There are literally entire job descriptions assigned to that. If someone walks into a store and leaves, at least we know we had foot traffic. But when someone takes one look at a drive-thru and keeps driving, there may be no clean record of the demand that was sitting right there.
This is an all too familiar battle for QSR operators.
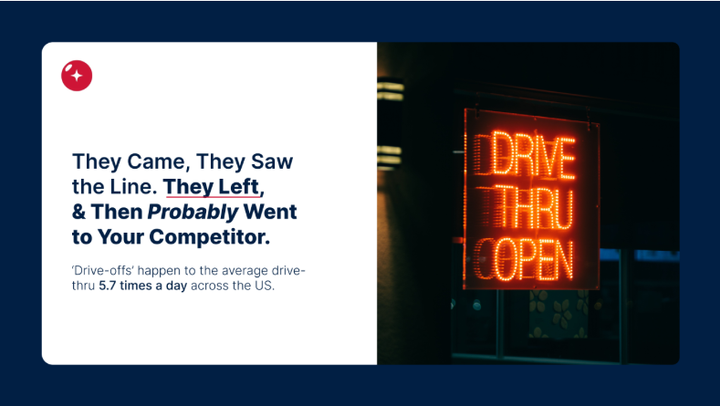
Research from QSR Magazine surveying more than 2,000 restaurant leaders found that the average drive-thru loses 5.7 cars every day to abandonment.
That’s before we even start talking about the customers who stay but could have moved through faster.
Because there are really two sides to the drive-thru speed problem. There are the cars you lose because the line looks like too much trouble, and there are the cars you never have the capacity to serve because the lane simply isn’t moving fast enough.
For operators, the second number can get very big, very quickly.
One More Car an Hour Is Actually a Lot of Revenue
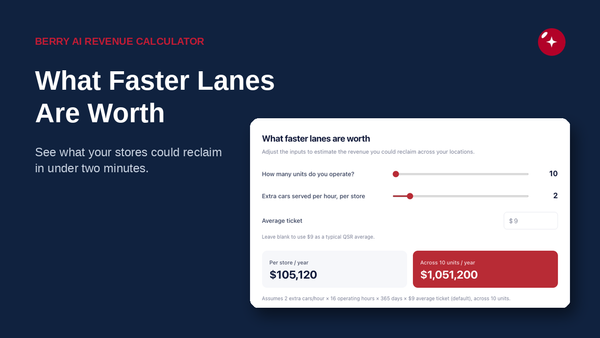
Take a 10-unit operator. If each restaurant could serve just one additional car per hour, at a $15 average ticket over 16 operating hours, that works out to $87,600 per store over a year. Across 10 stores, it’s $876,000.
At two additional cars an hour, you’re looking at $1.75 million. At five, $4.38 million. Real life obviously won’t follow the calculator perfectly, but you don’t need to capture all of that for the number to get interesting.
And for a lot of QSRs, the drive-thru is already where most of the money is made. Among operators surveyed in a recent industry study, it accounts for an average 66.4% of restaurant revenue.
Okay, But Does This Actually Happen?
Okay, enough hypothetical math. One Zaxby’s operator actually got to see what was hiding in the drive-thru.
With better visibility into what was happening in the lane, they were able to spot opportunities their legacy loop timers weren’t catching. They reclaimed $15,000 in weekly revenue and improved comps by 7%.
Across Berry’s broader partner base, we’ve seen service times fall 20-40% and throughput improve by as much as 20%.
Which brings us back to the number we don’t know yet: yours.
Put Your Own Stores Through the Math
The industry averages give us a starting point, but your own numbers are a lot more useful. We built a free Revenue Calculator so you can plug in your store count, average ticket and potential additional cars served per hour to see what increased throughput could be worth across your operation.
Run it with one extra car an hour. Then try the number that feels realistic for your stores.
See what faster lanes are worth for your stores.